Customers don’t bother about your resource constraints. They care how long things take. When responses drag, frustration builds fast. Some leave quietly. Others post about it.
2025 support benchmarks show first replies now average just over nine hours, a clear improvement from the year before. That shift matters. Early contact often decides whether a case moves smoothly or turns into multiple follow-ups.
This is where turnaround time, or TAT, comes in. It tracks the full journey from request to completion. When turnaround slows, customers notice. When it improves, trust grows. Let’s understand the TAT meaning in business.
What Does TAT Mean in Business?
The TAT full form in corporate environments is Turnaround Time.
The TAT meaning in business refers to the total time interval required to complete a task from start to finish. The clock starts when a request arrives. It stops when the task reaches full completion and delivery.
- A customer submits a support request
- A prospect fills out a lead form
- An employee reports an IT issue
- A hospital receives a lab request
- A supply chain team receives a production or replenishment order
The turn around time meaning covers every step between those points to complete a process. Waiting time counts. Approval delays count. Handoffs count. Rework counts.
Many teams measure response time and assume performance looks good. That hides the real delay. A quick reply does not reduce turnaround if resolution takes days. True TAT measures the full cycle, not the benefits of thefirst action.
Key Turnaround Time Metrics & Benchmarks
| Area | Excellent (TAT) | Standard (TAT) |
|---|---|---|
Why Turnaround Time (TAT) is Important for Businesses?
The difference in turnaround time affects customer trust, money speed, duration, and brand perception. It acts as a business health indicator.
1. Impact of TAT in Customer Service
In TAT in customer service, speed builds trust. Delay damages it.
When customers report a problem, they expect fast acknowledgment and clear resolution. Long gaps make customers assume the company lacks control over its operations.
Consider two service providers. Both fix billing errors. One resolves cases within six hours. The other takes three days. Customers remember the faster experience. That memory shapes future purchase decisions.
This explains why teams search what is TAT in customer service. Support speed shapes retention, not just satisfaction. Lower TAT reduces repeat calls, lowers backlog, and improves service ratings.
2. Impact on Sales and Revenue
Sales depend on timing. When a prospect shows interest, the window to act stays short. Fast follow-up keeps attention high and gives you a competitive edge. Delay allows competitors to step in.
Slow proposal turnaround raises doubts about reliability. Long approval cycles stretch deal timelines. That slows revenue flow and increases drop-off risk.
Teams that automate their outreach with tools like SalesRobot cut response lag significantly, ensuring prospects hear back before a competitor does.
3. Impact on Brand Reputation
Customers don’t think about internal systems, approval flows, or staffing gaps. They think about how long they’re left waiting. That wait often becomes their main impression of the company.
When people check reviews, they look for signals of reliability. Speed of response and resolution stand out because they’re easy to understand. Phrases like “quick help” or “took forever” carry more weight than technical details about the product.
Consistent speed creates a sense that the business runs with control and discipline. Repeated delays suggest confusion behind the scenes, even when the product itself works well. Over time, turnaround time influences brand reputation as strongly as pricing or features.
TAT Examples Across Different Business Functions
Every department has its own version of the importance of turnaround time. The steps may look similar: a request comes in, work happens, a result goes out, but the reasons for delay change depending on the workflow, number of handoffs, and approval layers involved.
A. TAT in Customer Support
In support environments, TAT in customer service directly shapes customer perception of reliability. Delays in specific processes do not just slow resolution. They increase emotional frustration, which leads to escalations and poor reviews.
1. Call Response Time
This measures how long a customer waits before speaking to an agent. Long wait times create negative sentiment before problem-solving even begins. High response TAT often comes from poor forecasting, rigid shift structures, or uneven call distribution between teams.
- Response Time = Time Call Answered – Time Call Received
2. Ticket Resolution Time
This measures the time from ticket creation to full resolution. Most delays here do not happen during active work. They happen while waiting for customer replies, internal approvals, or technical input. Organizations that fail to track these idle stages underestimate real turnaround.
- Total Resolution Time / Total Number of Resolved Tickets
3. Follow-up Turnaround
Agents often promise updates within a certain timeframe. When follow-ups arrive late, trust drops, even if technical progress continues. Many support teams lack structured follow-up systems, which causes avoidable delays. Support TAT improves when companies reduce internal waiting time.
- Turnaround Time = Completion Time - Initiation Time
B. TAT in Sales
Sales teams operate in time-sensitive environments where speed signals professionalism and reliability.
1. Lead Response Time
This measures how quickly a sales rep contacts a new lead. Studies consistently show that conversion probability drops sharply after the first hour. Delays often happen due to manual lead assignment or unclear ownership between marketing and sales teams.
- Individual Lead Response Time: Time of First Response - Time of Initial Contact
- Average Lead Response Time: Sum of All Response Times / Total Number Of Leads
2. Proposal Turnaround
After discovery calls, prospects expect structured proposals. Slow turnaround usually results from internal approval chains, pricing clarification delays, or poor template systems. Each extra day increases the chance that the prospect engages a competitor.
- Turnaround Time = Submission Date - Receipt Date
3. Deal Closure Cycle
This measures the time from the first conversation to the signed agreement. Long cycles often hide internal friction, such as legal reviews, finance approvals, or contract revision loops. When these internal processes lack deadlines, deals stall even when the buyer’s intent is strong.
- Total Days to Close All Deals / Number of Closed Deals
Sales TAT improves when internal approval systems move as fast as customer expectations.
C. TAT in IT & SaaS Businesses
In technology companies, turnaround time directly affects user trust and retention.
1. Issue Resolution
This measures the time between a reported issue and a deployed fix. Delays often come from unclear priority frameworks or overloaded engineering backlogs. When critical issues sit in queues, customer frustration grows quickly.
- (Total Resolved Issues ÷ Total Issues Reported) × 100
2. Bug Fixing Timelines
Known bugs that stay unresolved create long-term dissatisfaction. Many teams track bug count, but not bug turnaround. Without a fix-time metric, technical debt quietly increases.
- Turnaround Time = Bug Resolution Date/Time - Bug Creation Date/Time
3. Feature Deployment
This measures the time from feature approval to production release. Delays often occur during testing, cross-team dependencies, or release scheduling. Long deployment cycles reduce competitive speed and frustrate customers waiting for promised improvements.
- Deployment Frequency = Total Number of Successful Deployments / Time Period (Days/Weeks/Months)
D. TAT in BPO and Call Center
TAT meaning in BPO carries contractual weight. Service providers often operate under strict service level agreements that define turnaround expectations.
- Insurance claim processing within defined hours
- Email query resolution within one business day
- Escalation handling within fixed response windows
Delays often come from heavy case loads, missing information from clients, or confusion around escalation steps. Because outsourcing clients monitor turnaround time closely, repeated delays can result in penalties or even loss of the contract.
In computing, TAT means the time a process spends waiting in the ready queue, the actual execution time on the Central Processing Unit (CPU), and any time consumed by Input/Output (I/O) operations.
TAT in Finance includes concepts and calculations related to asset turnover and revenue generation. Understanding these metrics can help businesses assess their financial efficiency. In financial contexts, TAT can stand for Total Asset Turnover, measuring revenue generation relative to total asset value.
Key Components of Turnaround Time (TAT)
Turnaround time has three main stages: first contact, the resolution phase, and final closure.
1. First Contact
This stage begins when a request arrives and ends when acknowledgment occurs. Delays here often come from:
- Unmonitored inboxes
- Equipment not working properly
- No automated acknowledgment system
- Unclear request for ownership
When the time taken to complete acknowledgment is too long, customers submit duplicate requests or escalate prematurely. This increases workload and creates artificial backlogs. Strong first contact processes reduce unnecessary pressure later in the workflow.
2. Resolution Process
This stage includes all actions required to solve the problem. It usually consumes the largest and most crucial share of TAT analysis. Common delay sources include:
- Waiting for cross-department input
- Approval bottlenecks
- Unclear escalation paths
- Rework due to incomplete information
Mapping this stage often reveals that tasks remain idle longer than they stay in active work. Reducing idle time often cuts turnaround faster than increasing staff.
3. Final Resolution
This stage covers delivery and confirmation of completion. Delays here often occur because teams consider the work finished once the internal task ends. If the customer does not receive confirmation quickly, they assume the issue remains open. Fast and clear closure prevents repeat follow-ups and improves satisfaction scores.
How to Calculate Turnaround Time (TAT)?
The basic formula stays simple:
- Completion Time – Request Time
However, expert teams go further. They track TAT across multiple dimensions.
- Average TAT shows typical performance.
- Shorter TAT shows companies can get top talent before competitors.
- Long TAT reveals extreme delays that damage customer trust.
- TAT by category shows which request types take the longest.
For example, password reset requests may average 10 minutes, while technical integration issues may take 36 hours. Without segmentation, teams set unrealistic targets or overlook serious bottlenecks.
Advanced teams also track stage-wise TAT: time to first contact, time in processing, and time to final closure. This breakdown reveals where improvement efforts should focus.
Common Challenges That Increase TAT
Turnaround delays usually come from structural gaps in process, visibility, and system design.
1. Manual Processes and Outdated Tools
When teams move data between multiple systems by hand, search for details across emails or spreadsheets, or maintain offline trackers, each step in TAT reduction takes longer than necessary. Manual handling also increases the chance of errors. Even small mistakes create rework, which adds extra hours or days to the final resolution time.
2. Poor Internal Communication
When departments operate separately without shared visibility, requests often sit idle between handoffs. One team may assume another has taken ownership, while the clock continues to run. Without shared dashboards, clear responsibility, and status updates, no one monitors the full turnaround timeline from start to finish.
3. Lack of Call Tracking and Analytics
Without reliable data, the delay feels unpredictable. Managers rely on assumptions of competitive advantages and lead time instead of facts. This makes it difficult to identify whether the problem comes from peak-hour overload, repeated call transfers, or specific issue types. With proper tracking, patterns become visible, and delays become easier to fix.
4. High Call Volume with Limited Staff
When incoming demand exceeds team capacity, queues grow quickly. However, hiring more agents does not automatically solve the issue. If routing logic, workflows, or tools remain inefficient, new staff simply handle the same bottlenecks at a higher operational cost.
5. Inefficient Call Routing
When customers reach the wrong department first, resolution slows down immediately. Each transfer adds wait time and forces customers to repeat information. This not only increases turnaround time but also lowers customer satisfaction. Accurate routing at the first internoticeably reduce total TATiceable way.
How to Improve TAT in Business?
Reducing TAT requires system-level changes. When the structure supports speed, performance improves without staff exhaustion.
1. Automate Communication Workflows
Automation removes idle gaps between steps and cuts dependence on manual follow-ups. Requests move forward through predefined triggers instead of waiting in inboxes or task lists. Status updates, reminders, and task assignments happen automatically, which keeps work on track without unnecessary pauses. It also improves service quality.
2. IVR Systems
IVR directs callers to the right department based on their need at the first interaction. Clear menu paths reduce confusion and prevent misrouting. When customers reach the correct team immediately, resolution starts sooner, and total handling time drops.
3. Call Routing Automation
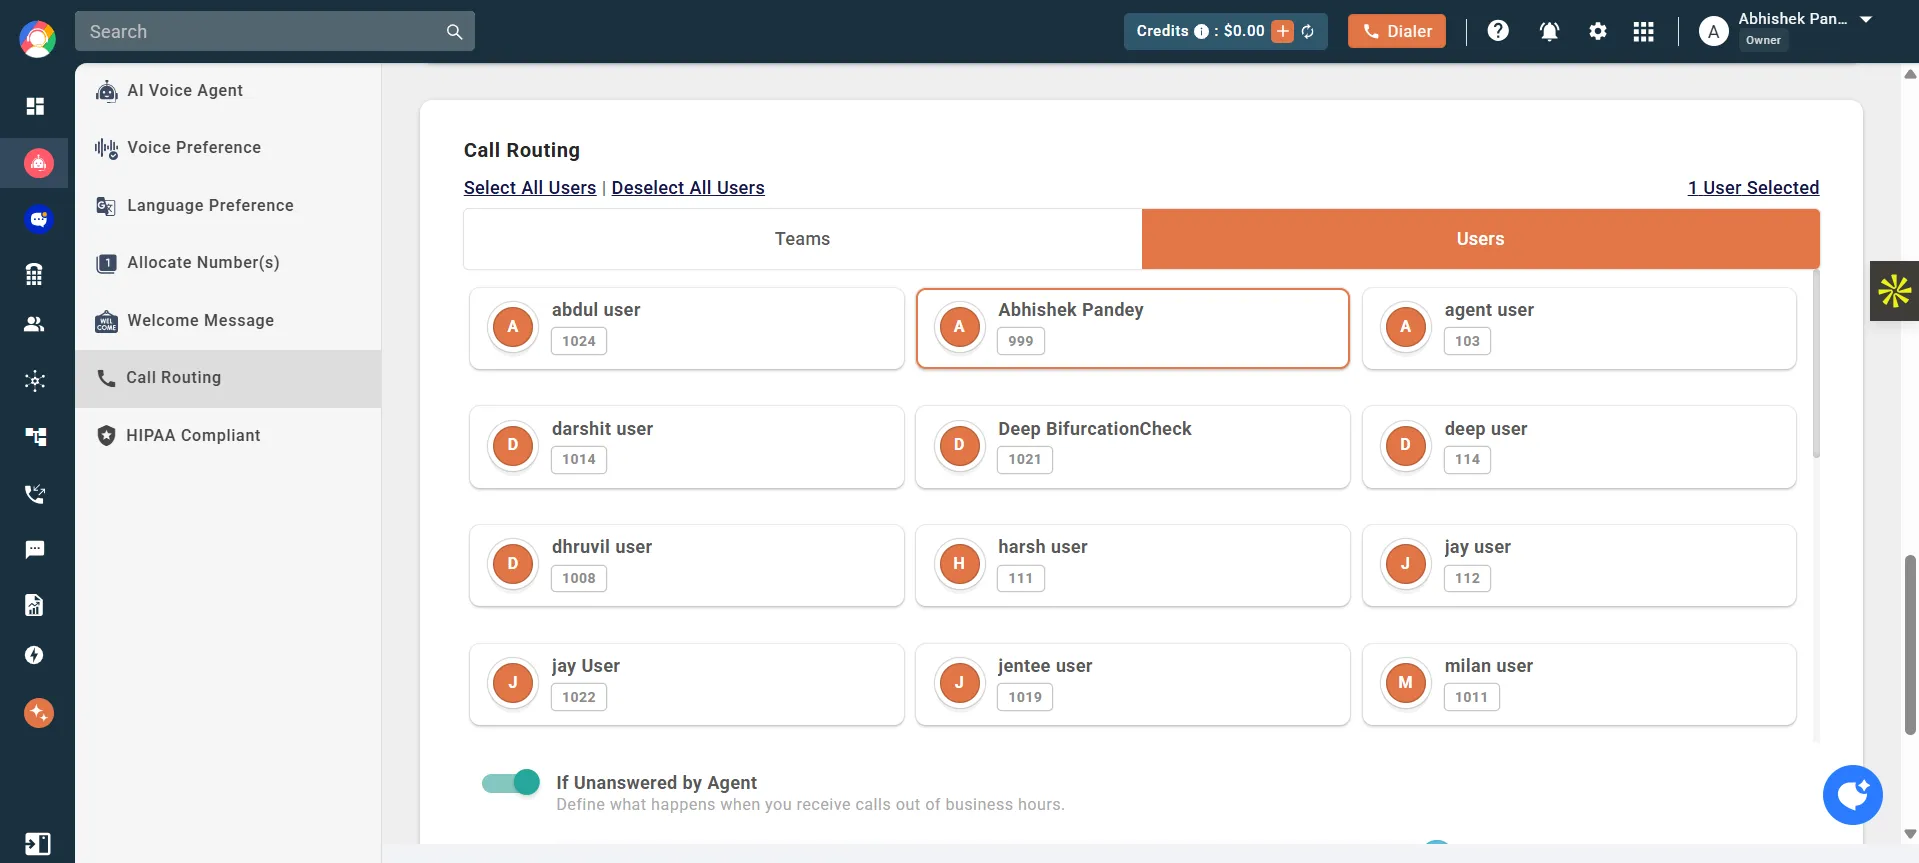
Skill-based routing connects customers with agents who have the right expertise from the start. This avoids multiple transfers and repeated explanations. Matching query type with agent skill improves first-contact resolution and shortens the overall service cycle.
4. CRM Integration
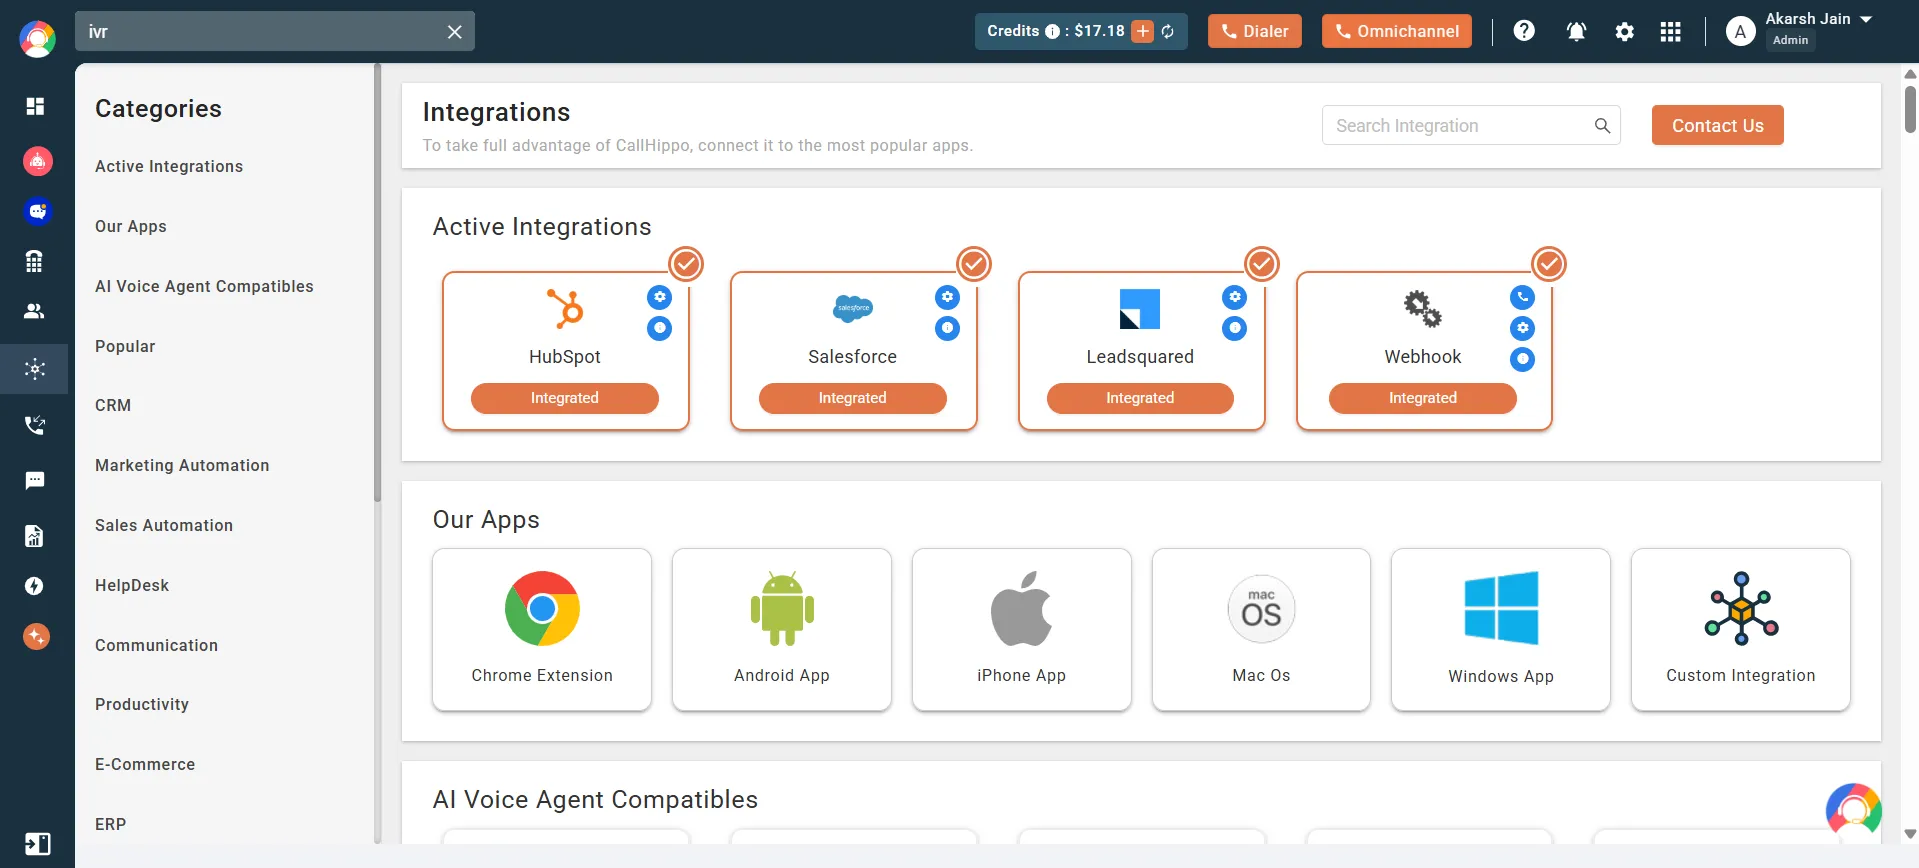
CRM access gives agents a full view of customer history, past interactions, and account details in one place. Instead of spending time collecting basic details again, agents can focus directly on solving the issue. This improves accuracy and reduces the time needed to close each request.
5. Use Cloud-Based Calling Solutions
Cloud platforms improve turnaround by supporting flexible team structures, better call distribution, and real-time visibility. Managers can adjust staffing based on live demand. Remote teams can operate without system limitations. These factors reduce delays in customer service and improve response speed in sales communication.
6. Train Teams for Faster Resolution
Training should build strong product knowledge, clear decision authority, and confidence in handling exceptions. Using a platform for employee training can help standardize learning and ensure teams stay up to date. When agents understand policies and edge cases, they can close cases without repeated escalations. This reduces internal waiting time and shortens the resolution stage.
7. Monitor and Analyze TAT Metrics
Regular performance review and continuous monitoring help uncover hidden delay patterns. Teams should track TAT by issue type, department, and time period. This level of detail shows whether delays come from staffing shortages, workflow gaps, or system limitations. Fixing the longest delay stage usually delivers the fastest improvement.
A report found that teams with structured workflows averaged about 22 hours per ticket, down from over 24 hours the year before, showing how process changes reduce turnaround time.
How Does CallHippo Improve Turnaround Time in Sales and Support?
CallHippo helps cut the communication delays that often stretch turnaround time in sales and support teams. It focuses on key aspects like making sure calls reach the right person fast and that agents have the context they need to resolve issues without back-and-forth.
- Intelligent call routing sends customers to the right agent based on skills or availability. This reduces unnecessary transfers and shortens the path to resolution, and helps with timely responses.
- CRM integrations show full customer details during the call. Agents don’t have to ask repeat questions or search across systems for history.
- Call tracking and analytics reveal where delays happen, such as long wait times, repeated transfers, or missed calls. Managers can see exactly where response time slows down.
- Real-time dashboards show live team performance. Supervisors can step in quickly when queues rise or response times slip.
Sales teams contact leads faster, which improves the chance of conversion. Support teams close cases with fewer handoffs. Together, these improvements reduce overall turnaround time across customer conversations.
FAQs
1. What is a good TAT for customer support?
A strong customer support turnaround time resolves most tickets within 24 hours, while phone and live chat issues close within minutes; more complex problems may require 48 to 72 hours.
2. How does TAT affect customer retention?
Fast turnaround idea builds trust. Customers stay where problems receive quick resolution. Slow service pushes them toward competitors.
3. Can TAT be automated?
Some parts can be automated, such as routing, acknowledgments, and follow-ups. Complex problem-solving still requires human expertise.
Published : February 18, 2026

Priya Naha is an experienced technical content writer who focuses on VoIP and telephony technologies. Her expertise in telecommunication and content marketing allows her to simplify complex topics with real-world knowledge, making her writing relatable, informative, and easy-to-read. Her direct involvement with VoIP products and solutions makes her a reliable voice in the field.

Subscribe to our newsletter & never miss our latest news and promotions.