
Imagine stepping into a buzzing call center as the new manager. Phones ring, agents chatter, and screens flicker with endless activity.
Overwhelming, right?
That’s where call center reporting tools come to the rescue. These solutions highlight the hidden patterns of your operation.
From call volumes and average duration to queue activity and customer satisfaction, a call center report reveals the true story behind the noise. Whether you’re managing a small team or a massive center, these tools can change how you work.
Curious to see the top tools that can transform your work? Let’s dive in and explore the world of call center reporting!
What is Call Center Reporting?
Call center reporting is a process that converts the raw data collected from your ACD, IVR, and WFM systems into successful and insightful reports. With such insight reports, businesses can easily get a clear picture of their performance, especially on conversion rates.
Call Center Reporting Vs. Analytics
| S.no | Call Center Reporting | Call Center Analytics |
| 1 | It turns the data into reports in an understandable manner. The data in the report helps to predict the call center’s performance. | It helps to identify the patterns and trends from the report. This allows managers to take proper action to make changes for improvement. |
| 2 | It provides the report as data, but agents and managers analyze it. | It allows you to identify why the problem is rising and makes you take action for improvement. |
| 3 | For example, the report will point to you that the customer engagement is too low with your latest calling campaign compared to the previous one. | For example, analytics highlight that your hit rate is low. Because of that, you need to improve the contact list or calling quality. |
Both call center reports and analytics are vital if you intend to have a good contact center solution. Almost both are interchangeable.
However, that doesn’t mean that they are the same.
Yes! They are different; look over the table to clearly understand how they differ.
Types of Contact Center Reports
As mentioned above, Contact center reports pinpoint the key performance of activities of the call center along with the individual performance of the agents working in the specific contact center. Regarding contact center reporting activities, there are numerous reporting formats in practice.
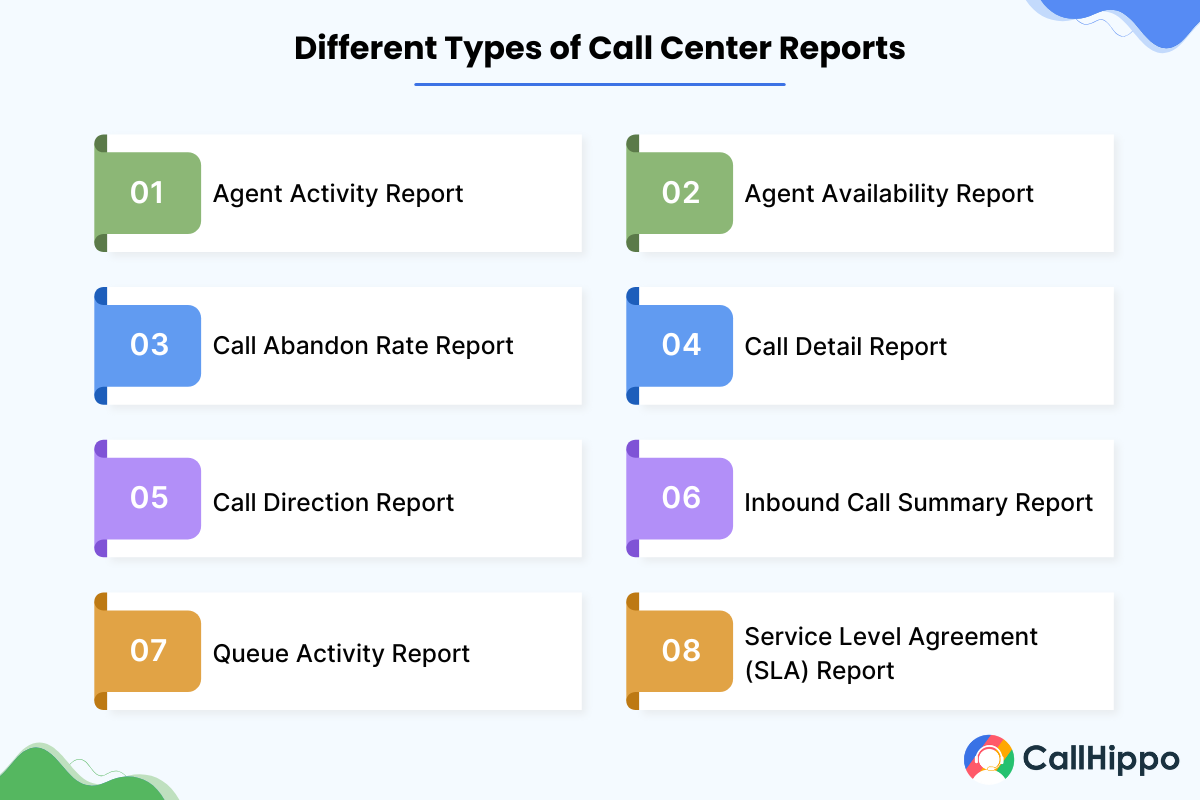
Here are the lists of detailed information containing the key 8 typical call center reports used by call centers worldwide.
1. Agent Activity Report
It provides actionable insights into the individual agents working in the call center. Call center managers can utilize the reports to track agents’ performances and take action to improve work efficiency. Here are lists of some critical statistical aspects in this agent activity report.
- Details of incoming calls handled
- Information on the total number of times the agent takes to handle incoming calls
- Predicting average time for a call
- Spotting the shortest and most prolonged time for a call
2. Agent Availability Report
Agent availability report, also known as agent status report, gives you the complete details of a call center agent, including user IDs, name, and the ACD (Automatic Call Distribution) state.
Here are the lists of some key ACD states you can find in this report type:
- Signing in or signed out details
- The total number of available times
- Busy timing
- Wrapping up information
- Idle and unavailable timing
- Breaking details
3. Call Abandon Rate Report
This report provides the complete details of the abandoned inbound calls and the percentage information. In addition, this typical report on call abandon includes the average waiting time of a caller to leave the call. This helps call center managers take measures to reduce the call abandonment.
Furthermore, the call abandon reports help call center managers identify whether they are losing potential customers by conducting a proper analysis of the waiting time of a caller before abandoning the call.
4. Call Detail Report
This typical call detail report includes all the details regarding the call, including the caller’s information, starting & ending times of a call, and the details pointing to the time duration of the caller waiting in the queue.
The quality assurance team can utilize more from the call detail reports for reviewing the call center agents.
5. Call Direction Report
Also known as the call transfer report, the call direction report details the total number of calls made or received in a specific period. With this report, call center managers can easily identify the demands of the call center and carry out contact center forecasting.
6. Inbound Call Summary Report
This call summary report helps call center managers get complete statistical reports of the inbound calls made during a specific period of time. The report helps managers forecast call volumes of the call center during peak hours or any specific time.
Inbound call summary reports generally include:
- The total number of calls handled
- The number of calls contact center agents answered
- The number of calls gets abandoned
- Overall talking time on handling the inbound calls
- Answering the speed of the agents while handling calls
7. Queue Activity Report
This typical activity report provides the complete details of the customer behavior, including their waiting period, timeframes on queues, etc. In addition, this report also offers how many calls were handled by the call center based on each queue.
8. Service Level Agreement (SLA) Report
As the name suggests, an SLA is a service requirement agreement between the call center and the client. With this report, call center managers can get insightful values through real-time monitoring and effective call center dashboards. Also, the SLA reports help managers identify whether there has been a breach during the campaign or queue.
Must-Have Features of Call Center Reporting Tools
The top call center reporting software is key for businesses to increase and achieve productivity goals. You can easily spot various cloud contact center solutions with unique features in today’s market. You must ensure all the essential features are enlisted to pick the right platform. Here are the must-have features listed.
- Ability to provide a customized view of the data
- Real-time dashboards for every team member with widget-based
- Provisions for managers and supervisors to overview the team performances
- Should allow call center agents to access their workload at any time
- Contact center reporting tools should come with built-in reporting options for a better understanding of contact center performance based on the metrics
- Ability to build custom reports
- Offering secured data access to the company’s data analysts
- Access to call center metrics analytics and reporting to enhance customer interaction with the business
Having contact center reporting software with all those essential features, your BI (Business Intelligence) can make a smart and actionable decision.
Benefits of Call Center Reporting
Investing in a business phone system can give your organization a competitive edge through better reports and business intelligence: Businesses that rely on call centers to interact with their customers can derive various benefits from call center reporting. Below are the key benefits of call center reporting listed.
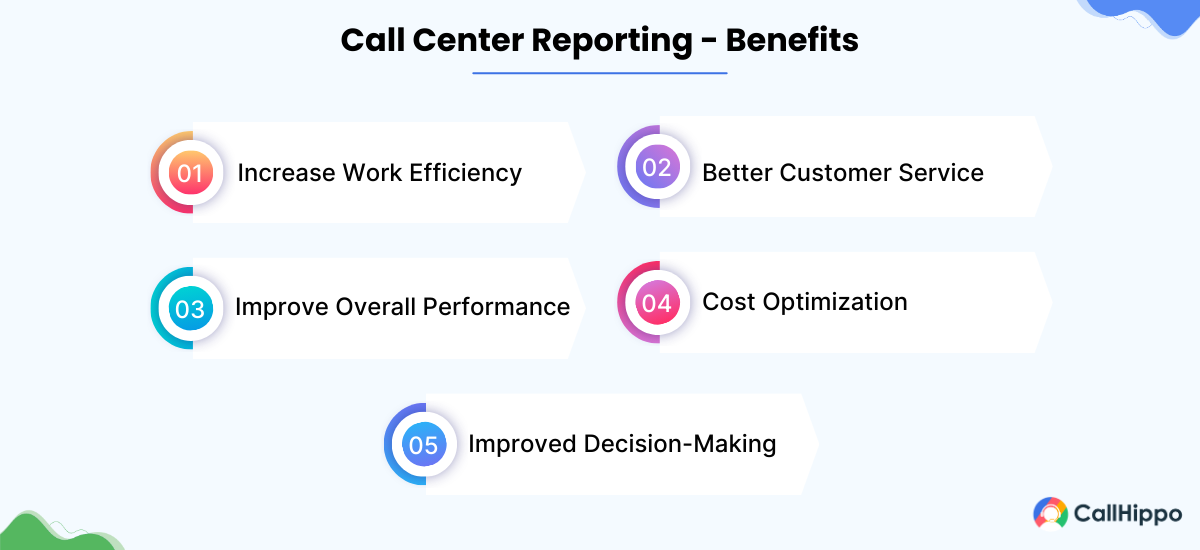
1. Increase Work Efficiency
Once your agent improves their work efficiency, like handling customer issues effectively, it automatically improves your call center efficiency. Monitoring key metrics such as call resolution and agent performance can be made easier with advanced quality management systems.
2. Better Customer Service
Real-time call center reporting impacts customer retention rates, improves sales, and more. Moreover, once you understand your customer, you can know what efforts you need to put in.
3. Improve Overall Performance
Contact center reporting enables users to identify areas by tracking metrics like first-call resolution, average handle time, and customer satisfaction. This helps them find specific areas for improvement and take data-driven actions to enhance overall performance.
4. Cost Optimization
Having a good call center reporting tool allows you to take measures to streamline the operational value of your business and cost efficiency. Also, it eliminates the essence of mediators for identifying customers’ basic needs.
5. Improved Decision-Making
Contact center reporting helps provide insights into patterns and trends; thus, they can make informed decisions about training, staffing, and resource allocation.
Best Practices for Call Center Reporting
Effective call center reporting is crucial for optimizing operations and enhancing customer satisfaction. Here’s how you can overcome common challenges and create impactful reports that drive meaningful improvements.
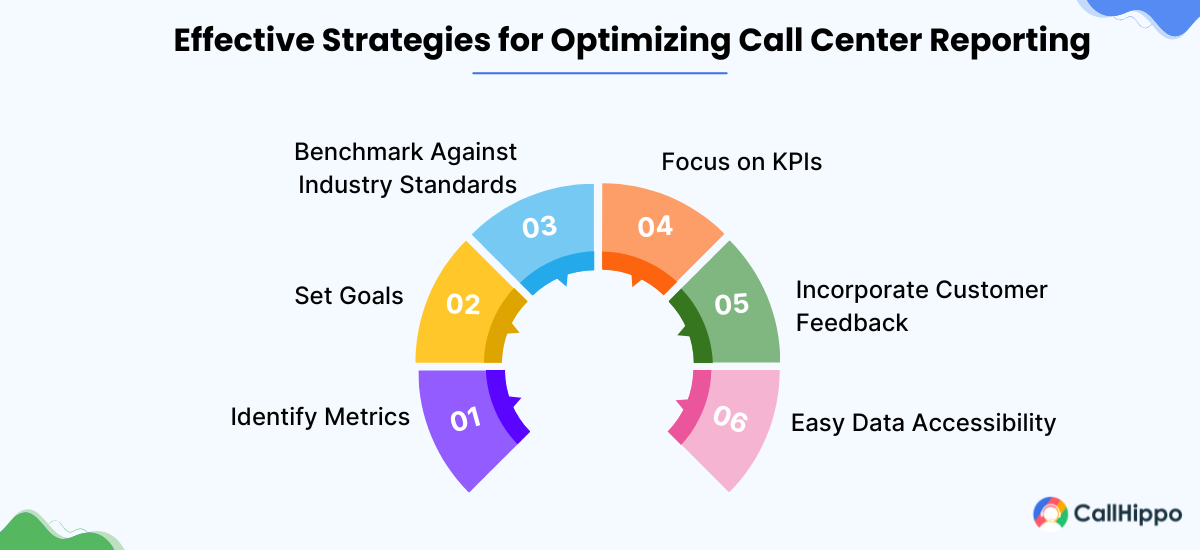
1. Identify Metrics
Focus on metrics that directly impact your business objectives. These may include:
- Customer Satisfaction Score (CSAT)
- Net Promoter Score (NPS)
- First Call Resolution (FCR)
- Average Handle Time (AHT)
- Call Abandonment Rate
Select metrics that align with your specific goals and industry standards.
2. Set Goals
Establish SMART (Specific, Measurable, Achievable, Relevant, Time-bound) goals based on your identified metrics. For example:
- Increase CSAT score from 80% to 85% within six months
- Reduce Average Handle Time by 10% over the next quarter
Regularly review and adjust these goals as your call center evolves.
3. Benchmark Against Industry Standards
Use industry benchmarks to gauge your performance relative to competitors. This practice helps:
- Identify areas for improvement
- Set realistic targets
- Motivate your team by showcasing progress
Remember that benchmarks can vary by industry, so choose relevant comparisons.
4. Focus on KPIs
Prioritize call center key performance indicators (KPIs) that drive actionable insights. Regularly review KPIs to ensure they remain relevant to your current business objectives. Key examples include:
- First Contact Resolution: Impacts customer satisfaction and operational efficiency
- Average Speed of Answer: Affects customer experience and agent utilization
- Customer Effort Score: Measures ease of customer interactions
5. Incorporate Customer Feedback
Integrate customer feedback into your reporting through post-call surveys, social media sentiment analysis, and customer interviews. This provides context to your quantitative metrics and highlights areas for improvement from the customer’s perspective.
6. Easy Data Accessibility
Make performance data readily available to agents and managers:
- Implement user-friendly dashboards
- Provide real-time updates on key metrics
- Offer training on data interpretation and application
This fosters a data-driven culture and empowers agents to take ownership of their performance.
Key Metrics in Contact Center Reporting
Reaping the benefits of contact or call center reporting is impossible if you don’t understand its key metrics or KPIs (key performance indicators). These metrics offer super valuable insights into cost-effectiveness, contact center or call center agent performance, and customer experience to those who understand and decode them well.
Here are the three major metrics that you must understand well –
1. Performance metrics
Contact or call center agent performance metrics refer to the indicators that tell you about your agent’s efficiency in managing regular customer calls. It gives you insights into your agent’s speed and precision in responding to and handling queries.
Based on the collected information, you can coach your agents and improve your overall strategy. Agents can then meet and surpass your customer interaction and service standards.
Average handle time (AHT)
Contact centers use average handle time to measure the average duration of agent-customer interactions. It is calculated from the moment the customer calls and ends when the query is finally resolved. AHT includes actual talk time, transfer times, hold times, and after-call work (time agents spend to analyze or follow up on the query).
AHT formula
Average handle time = Total of (talk time + hold time + after-call work time) / Total calls (in number)
Low AHT is the aim as it indicates that agents are resolving issues instantly, streamlining customer service. When queries are resolved promptly, customer satisfaction will rise, and call center costs will go down due to less number of calls.
Note: Balance AHT with quality of service to ensure that instant query resolution doesn’t leave customers unsatisfied or compromise interaction effectiveness.
First contact resolution (FCR)
First call resolution enables you to evaluate an agent’s ability to solve customer issues in one interaction. It shows you the percentage of queries an agent can settle in the first ever contact with a customer with zero transfers, pauses, or escalations.
This is crucial for customer happiness, as 70% of customers get annoyed when their calls are transferred between departments.
FCR formula
First call resolution = Total number of calls settled in the first interaction/ total number of inbound calls
Monitoring your FCR can help you improve customer satisfaction, reduce customer effort, and lower frustration. Hence, you should always aim to keep your FCR high.
Customer satisfaction score (CSAT)
CSAT score indicates customer satisfaction level after a customer interacts with your customer service agent. You need to extract your CSAT score from CSAT surveys. These surveys intentionally include open-ended questions to accurately store detailed customer feedback and a relevant score based on the feedback.
To calculate your CSAT score, request your customers to rate your customer service out of 5 or 10. Then, apply the formula.
CSAT formula:
CSAT score = (Total number of satisfied customers / Total number of survey responses) X 100
You must calculate your CSAT score consistently to better gauge whether your agents’ performance aligns with customer expectations. If not, start training or coaching them immediately. Remember, a high CSAT is an indication of happy customers. So, don’t forget to pat your back if it’s high.
Improve Your Customer Satisfaction Score With CallHippo AI?
Use CallHippo Ai's sentiment analysis to understand customer sentiment and improve customer satisfaction.
2. Operations metrics
Contact or call center operations metrics enable you to gauge how effectively your operations are flowing. It directly lets you dive into your call center’s operational performance over time. Monitoring operations metrics is important to identify trends, peak times, and staffing needs. These metrics also help you get an overview of the effect of your company’s past initiatives on call volumes. The best examples of company initiatives are marketing campaigns and product launches.
Call abandonment rate
Call abandonment rate refers to the percentage of incoming calls that customers terminate or leave before even connecting with an agent. The reasons behind this termination may be complex IVR (interactive voice response) menus, unsatisfactory call routing systems, long hold times (44% of people get annoyed when the hold time is nearly 5 to 15 minutes), or inadequate staffing.
CAR Formula:
Call abandonment rate = (Total number of Calls – Total number of handled calls) / Total number of calls X 100
Monitoring it is important because a high abandonment rate indicates your call center agents are insufficient to handle the inbound call volumes. In such cases, you can timely optimize your staffing levels or include a callback option in the menu. This option enables customers to request a call back which eliminates draining time waiting on hold.
Queue time

Call center queue time is the duration a customer waits in the call queue until agents answer. During this wait time, customers are on hold and can only interact with the agent when their chance comes. Remember to keep the queue time short to deliver a better customer experience and raise customer satisfaction.
QT Formula:
Queue time = Sum of total wait time over all the calls/ Total number of calls answered
Monitoring queue time is important because else you’ll never know when customers are going past their waiting capacity. Long wait times invite more call abandonment and customer loss. Tracking it consistently will ensure it is short and customers are satisfied.
Service level agreement (SLA) compliance
This compliance metric evaluates your contact center’s efficiency based on call responsiveness. It is the rate of answered calls in a particular timeframe.
Your SLA might look like –
- Answering 80% of calls within 20 seconds (thumb rule for most organizations)
- Answering 80% of chats within 20 seconds
- Answering 100% of emails within 8 hours
SLA formula:
Service level = (Total number of calls responded to within a pre-set timeframe/Total number of inbound calls) X 100
It is essential to monitor and maintain a high service level to ensure satisfactory and prompt customer service delivery. When you regularly track service levels, managing staffing, call volumes, and resource allocation such that they meet customer expectations becomes easier.
3. Financial metrics
Financial metrics in contact center reporting measure your contact center’s financial performance and efficiency. These metrics often include cost per call and revenue per call. Monitoring your financial metrics is an indispensable part of reporting because it helps you evaluate your profitability, optimize resource allocation, and improve revenue.
With these metrics, you can identify areas that have scope to reduce costs to improve the overall financial position of your contact center.
Cost per call
Cost per call refers to the amount you are required to pay for each call. In other words, it is the average cost of every call your agent handles. Mostly, longer calls cost more but in some cases, longer calls save cost as the customer issue wouldn’t need another call.
Avoid this with proven contact center software, as it charges you a fixed price for unlimited calls. To improve your cost-per-call rate, you must improve training, use cloud-based CRM, and monitor performance metrics.
CPC Formula:
Cost per call = Total cost of all calls/ Total number of calls
Closely monitoring the cost per call is important because it gives you details on how cost-effective your call center operations are. It also helps you understand the issues in resource allocation so you can adjust them for lower cost per call.
Revenue per call
This metric refers to the average revenue a company earns from a particular customer interaction over calls (inbound or outbound). It is also coined as revenue per successful call, wherein all the dropped or abandoned calls are eliminated.
As a part of revenue per call, you’ll find whether or not agents are achieving their sales targets.
RPC Formula:
Revenue per call for a particular period or agent = Total revenue contact center generates in a timeframe/ total number of handled calls
Calculating revenue per call is non-negotiable because it makes you aware of your revenue-generating, popular products. You can either brush up on those for more revenue or launch similar products.
Note: To improve revenue per call, start delivering a great customer experience. As a result, you’ll also get a better customer retention rate, ultimately increasing future sales.
How to Create a Benchmarking Report for Your Contact Center?
Contact center benchmarking reports refer to those business reports that enable you to look at your company, performance, or product in comparison with other similar companies or products. With this comparison, you can easily identify opportunity areas in your industry or business. Let’s see how to create one –
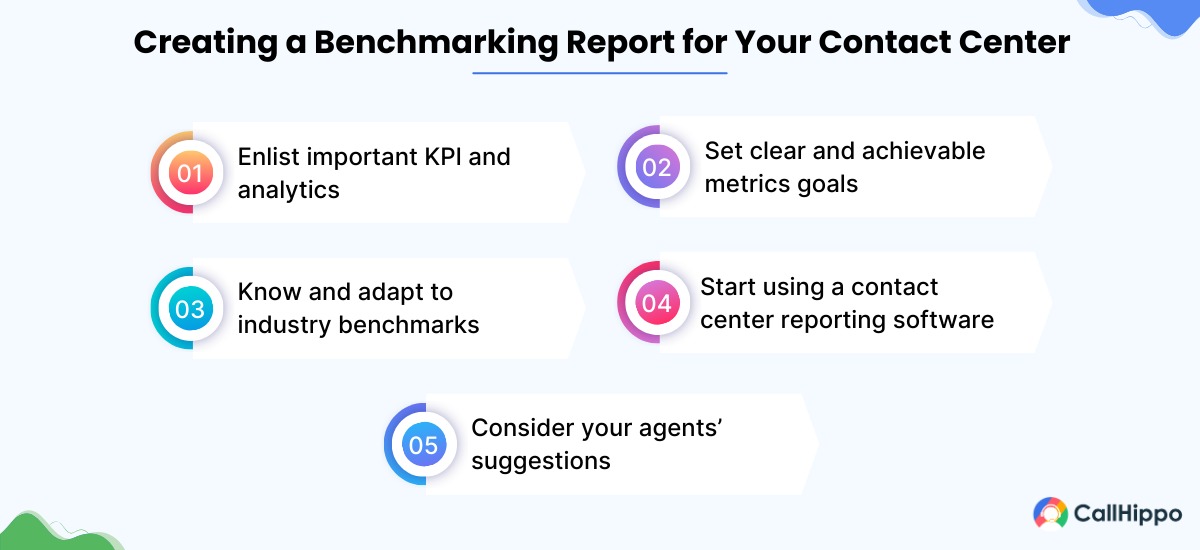
1. Enlist important KPI and analytics
The foremost step to creating benchmarking reports is defining relevant KPIs and analytics that align with your contact center’s objectives. While defining this, consider your sales and product lifecycle and the competitor product you want your report against.
For instance, if customer satisfaction is your priority, your KPI must include the First Call Resolution rate(FCR), Average Handle Times, and Customer Satisfaction Score (CSAT).
2. Set clear and achievable metrics goals
When creating benchmarking reports, it’s important to set realistic metrics standards and performance targets. Not doing so can demotivate agents for not being able to achieve goals even after making consistent efforts. Here it is also important to ensure that your set goals are not competing or conflicting with each other.
For instance, don’t try to improve FCR while lowering the average handle time, as this would confuse your agents and lead to no results.
3. Know and adapt to industry benchmarks
When you’re enlisting KPIs, try to keep them in line with business value, real-world expectations, and customer journey maps of your products. Above all, align with industry benchmarks. Why? Because this helps you set accurate goals for your team and ensure that your company doesn’t lag behind competitors.
Suppose the industry standard of FCR is around 70-79%. Now, if your FCR goes below this rate, you’ll spoil your customer’s experience and satisfaction.
4. Start using a contact center reporting software
With this software, you can easily digest data, analyze metrics, and track KPIs. It also offers real-time dashboards for you to track key metrics in real-time and immediately generate custom benchmarking reports containing your desired KPIs.
5. Consider your agents’ suggestions
Include agents’ inputs on workflows and customer interactions to make your benchmarking reports more real and transparent. Also, when agents contribute, they’ll automatically try to perform better and surpass the industry benchmarks.
Call Center Reporting Tools and Software
Although CallHippo is our tool, we’ve chosen these reporting solutions based on features, user reviews, and pricing. Our recommendations are unbiased, and there are no paid partnerships influencing our selections.
| Company | Rating | Plan | Top Features | Learn More |
|---|---|---|---|---|
Starter: $18/month Professional: $30 /month Ultimate: $42 /month |
| Learn More | ||
Digital-only: $175/month Voice-only: $175/month Digital + Voice: Custom Digital + Voice + WEM: Custom Digital + Voice + WEM + Analytics: Custom |
| Learn More | ||
 | Core: $20 Advance: $25 Ultra: $35 |
| Learn More | |
CX Cloud Essentials: $185/month CX Cloud Elevate: $115/month CX Cloud Elite: $145/month Experience Clouds: Custom |
| Learn More |
After extensive research and analysis, we have curated a list of call center reporting tools. These software are carefully selected based on usability and satisfaction scores, including features, ease of use, customer support, ratings, and reviews from SoftwareSuggest, G2, and Capterra. Our aim is to assist businesses in identifying the most suitable software to streamline their operations.
1. CallHippo
CallHippo is the leading call center reporting software that offers robust Contact center reporting tools designed to optimize performance and decision-making. Our platform provides real-time analytics, customizable dashboards, and detailed call logs.
With features like agent performance metrics, call volume tracking, and response time analysis, CallHippo enables businesses to gain valuable insights into their call center operations. Our user-friendly reporting interface also makes it easy to generate and share custom reports.
Features
- Identify the call source
- Call volume and duration
- Average call length
- Caller insights
- Real-time call tracking
- Call recording
Pros
- Real-time analytics dashboard that provides instant visibility into key performance metrics and call center activities.
- Highly customizable reporting interface that allows users to create tailored reports for specific business needs.
- Intuitive call tagging and categorization system that enables detailed analysis of call types and outcomes.
Cons
- Limited advanced predictive analytics and AI-driven insights compared to some enterprise-level competitors.
- Occasional lag in data synchronization during high-volume periods.
Pricing
- Basic: Free
- Starter: $18/user/month
- Professional: $30/user/month
- Ultimate: $42/user/month
*Pricing as on 22-10-2024*
with Real-Time Insights
- Advanced Call Center Reporting
- Monitor Agent Activity
- Talk-to-listen Ration
2. Five9
Five9 contact center analytics reporting tool offers a wide range of customizable reports, real-time dashboards, and historical data analysis.
Five9’s reporting features enable businesses to monitor agent productivity, call quality, and customer interactions across multiple channels. With its intuitive interface and robust data visualization capabilities, Five9 empowers call center managers to optimize performance and enhance the overall customer experience.
Features
- Session routing
- Enhanced IVR
- Inbound screen pop
- Administrator access
Pros
- Sophisticated AI-driven analytics engine providing predictive insights and trend forecasting.
- Extensive customization options for dashboards and reports, catering to diverse reporting needs across different roles.
- Robust quality management features, including speech analytics for in-depth evaluation.
Cons
- The platform's extensive feature set can lead to a steeper learning curve, particularly for smaller businesses or new users.
- Higher price points compared to some competitors may be prohibitive for budget-conscious organizations.
Pricing
Contact the company for a custom quote.
*Pricing as on 22-10-2024*
3. Zendesk Talk
Zendesk Talk offers comprehensive call center reporting capabilities within its customer service platform. It provides real-time and historical analytics, allowing businesses to track key metrics such as call volume, wait times, and agent performance. With customizable dashboards and easy-to-read visualizations, Zendesk Talk helps managers identify trends and make data-driven decisions to improve call center efficiency and customer satisfaction.
Features
- Real-time and historical data
- Pre-built dashboards for every channel
- Customizable dashboards and charts
- Sharing and collaboration
Pros
- Robust omnichannel reporting capabilities that consolidate data from voice, chat, email, and social media channels.
- Advanced sentiment analysis tools that provide insights into customer emotions and satisfaction levels.
- Flexible report scheduling and distribution system for automated delivery of key metrics to stakeholders.
Cons
- Customization options for advanced reports are limited compared to other call center analytics tools.
- Extracting certain types of granular data can be cumbersome and may require workarounds.
Pricing
- Suite Team: $55/user/month
- Suite Growth: $89/user/month
- Suite Professional: $115/user/month
*Pricing as on 22-10-2024*
4. RingCentral Contact Center
RingCentral Contact Center offers powerful reporting and analytics tools for comprehensive call center management. It provides real-time and historical reporting, customizable dashboards, and KPI tracking.
The platform enables managers to monitor agent performance, call volumes, and customer satisfaction metrics. With its intuitive interface and detailed insights, RingCentral helps businesses optimize their call center operations and improve customer service quality.
Features
- Journey analytics
- Knowledge management
- Guided customer journey
- Post-call speech analytics
Pros
- Comprehensive omnichannel analytics that unifies data from voice, chat, email, and social media interactions.
- Advanced workforce management tools integrated with reporting for optimized staffing.
- Customizable wallboards and dashboards for real-time performance visualization.
Cons
- The abundance of features can lead to a cluttered user interface, which can be overwhelming.
- The initial setup and configuration process can be complex and often require professional services.
Pricing
Contact the company for a custom quote.
*Pricing as on 22-10-2024*
5. Talkdesk
Talkdesk is another popular call center analytics reporting tool that delivers advanced call center reporting capabilities through its Cloud Communication Platform. It offers real-time and historical analytics, customizable reports, and interactive dashboards.
Talkdesk’s reporting tools provide insights into agent performance, call quality, and customer journey metrics. With its AI-driven analytics and user-friendly interface, Talkdesk empowers businesses to make data-informed decisions and enhance their call center efficiency.
Features
- Business intelligence and reporting
- Benchmark data
- Speech and text analytics
- Real-time sensors and automations
Pros
- AI-powered analytics engine that provides predictive insights and trend forecasting.
- Intuitive, drag-and-drop report builder that allows for easy creation of custom reports.
- Robust quality management features integrated with analytics for comprehensive performance evaluation.
Cons
- The full suite of advanced analytics features is only available in higher-priced enterprise plans.
- Historical data retention periods are limited in lower-tier plans.
Pricing:
- CX Cloud Essentials: $85 per user per month
- CX Cloud Elevate: $115 per user per month
- CX Cloud Elite: $145 per user per month
- Experience Clouds: Custom pricing
*Pricing as on 22-10-2024*
Guide to Contact Center Dashboards
Contact center dashboards are nothing but a tool that highlights the call center metrics analytics, reporting information, and KPIs. This enables call center managers to monitor and take necessary actions to optimize work performance.
For all modern businesses, a call center dashboard is an incredible and important power tool for optimizing the business workflow according to the evolving market conditions.
Here is the list of 3 practical call center dashboard examples associated with critical KPIs. This will help you to get a better understanding of call/contact and contact center reporting solution dashboards.
1. Call center Talk Dashboard
The Call Center Talk Dashboard provides detailed visualizations necessary for effective monitoring and performance analysis of calls. It consists of four key areas that allow call center managers to:
- Identify unsuccessful inbound calls: Track the number and reasons for calls that are not completed, which allows managers to address issues and improve customer accessibility.
- Predict all efficiency: Analyze historical data to forecast peak call times and adjust staffing levels accordingly to ensure that agents are available during high-demand periods.
- Analyze call activity: Review call duration and frequency metrics to understand call patterns, helping to optimize scheduling and agent allocation.
- Evaluate call quality: Use quality scoring metrics to assess the effectiveness of calls to provide insights for targeted training programs.
Primary KPIs of call center task dashboard:
- Unsuccessful inbound calls
- Monitoring agent activity
- Analysis talk efficiency
- Data-wise quality rating
2. Call center team dashboard
The call center team tool dashboard gives you a detailed view of daily, weekly, and monthly performance sheets. This enables contact center managers to provide the agents with a resolution and optimal service time details.
The dashboard offers a powerful and clear overview of the agent’s performance and results. This motivates the agents and takes measures to improve their performances.
- Assess average response time: Monitor the speed of agent responses to incoming calls, which is crucial for enhancing customer satisfaction.
- Track first-call resolution rates: Evaluate the frequency of agents resolving customer issues on the first call. This provides insights into agent effectiveness and identifies training needs.
- Spot top-performing agents: Identify agents who consistently meet or exceed performance targets to foster a culture of recognition and motivation.
- Detect Common issues: Analyze trends in customer inquiries to uncover recurring problems to enable proactive measures that enhance service quality.
3. Call center customer satisfaction dashboard
The dashboard of the call center customer satisfaction tool offers essential metrics like customer satisfaction level, customer retention rates, and so on. All those metrics will be vital in building better customer experience activities.
With this tool, you can drill down the evolving customer service department and create an effective customer strategy to boost customer retention rates.
Primary KPIs of call center customer satisfaction tool:
- Customer satisfaction level: Measures customer happiness through post-call surveys to provide feedback on agent performance.
- Score levels for promoter: Reflects Net Promoter Score (NPS)that indicates customer loyalty based on their likelihood to recommend the company.
- Effort score for customer: Assesses how easy it is for customers to resolve issues, with lower scores indicating a smoother experience.
- Customer retention rate: Tracks the percentage of customers who remain with the company over time.
Bottom Line
A contact center is essential for any business in today’s competitive market. Proper analysis of the contact center operations and call center data will allow businesses to rate their performances and improve the areas where they lack. However, you would need an excellent call center performance reporting tool to have an efficient contact center.
With good contact call center reporting, you can easily track down various aspects of your business, including the performance of your contact center, boosting customer experience, and enhancing communications. This empowers business stakeholders to make effective data-driven decisions and drive businesses toward achieving strategic goals.
FAQs
1. How to measure contact center performance
To measure contact center performance, follow these three key steps: First, find and utilize the best reporting tools available. Next, ensure all your data is consolidated in one place. Finally, use call center analytics to set informed goals that drive improvement and customer satisfaction.
2. What are the common call Center KPIs?
Common call center KPIs include first contact resolution (FCR), call arrival rate, blocked calls, average call duration, abandoned call percentage, average wait time, average turnover rate, and net promoter score (NPS). These metrics help gauge overall performance and customer experience.
3. How can call center reporting help to reduce costs?
Call center reporting reduces costs by streamlining business operations, saving both time and money. It also eliminates the need for middlemen by predicting basic customer needs and allows for more efficient resource allocation and improved customer service delivery.
Published : April 3, 2023

Supriya Bajaj is a senior content developer with immense experience in the VoIP telephony domain. With a deep knowledge of VoIP systems and emerging technologies in the field, she provides insightful and targeted content. Known for simplifying complex topics and her thought-leadership articles, Supriya delivers actionable content for both technical and non-technical audiences.

Subscribe to our newsletter & never miss our latest news and promotions.

